Analysis
As genomic data analysis becomes increasingly AI-driven, experience with conventional statistics helps me understand the limitations, and the potential, of the new innovative practices.
The following examples highlight hypothesis-driven statistics that test the connection between two molecular phenomena: transcription factor occupancy versus gene expression. Many of these analyses informed figures in the publication but were extraneous for the final manuscript.
We mentally idealize these processes to match the cartoons in our textbooks, but large datasets tell a different story.
 Learn more about this analysis
Multivariate/Multifactor Analysis
Big data has the implicit challenge of deriving meaning from multiple different factors. I used the following methods to conceptualize and explore associations between groups of transcription factor binding, C. elegans developmental stage, gene expression level, and genetic modification.
These methods go beyond repeating simple statistical tests for all group levels and comparisons. They have a full concept of the data and the statistical question, do not exclude groups unconsidered in our framing of the question, and account for multiple comparisons.
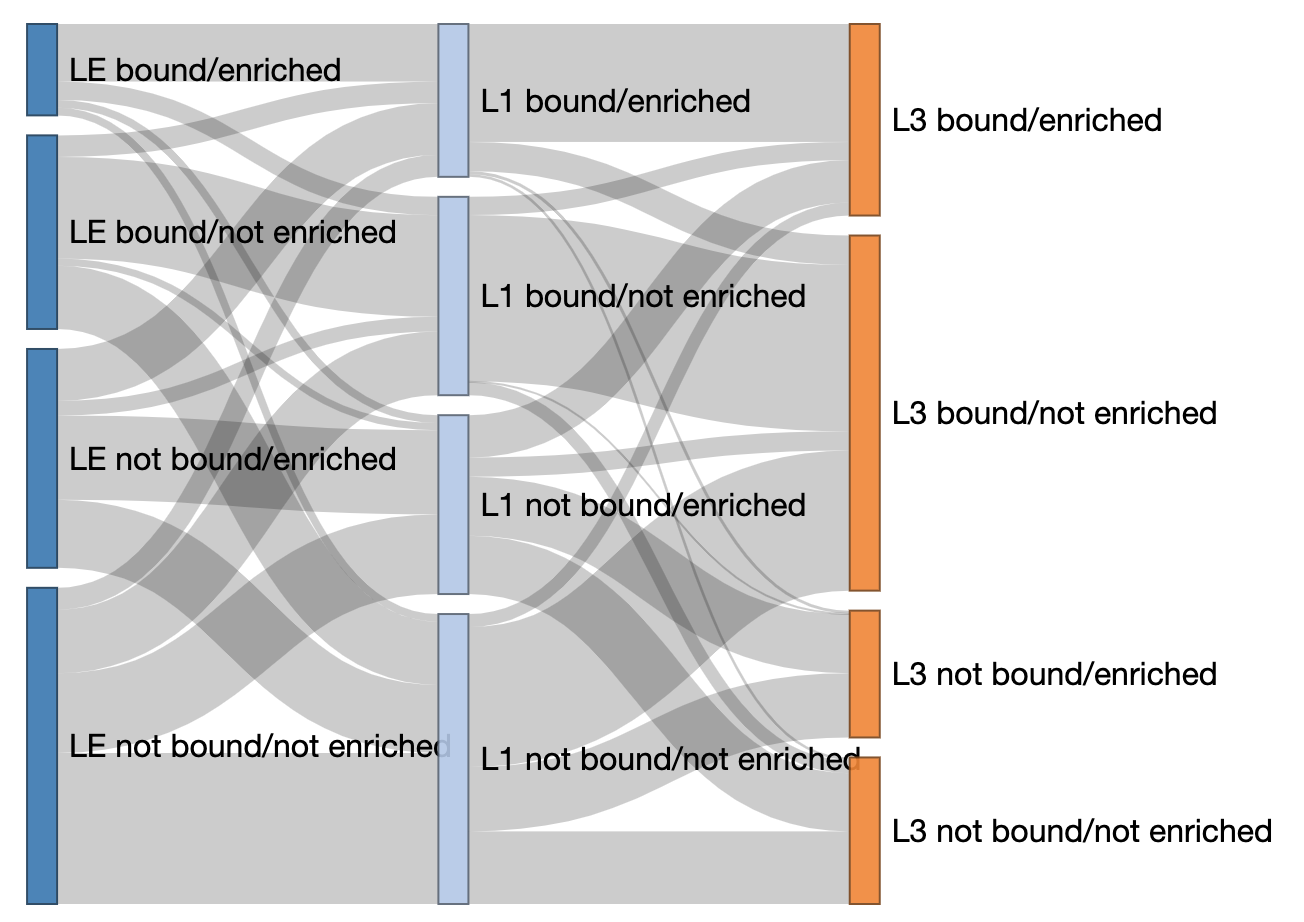
Sankey
Question: Do promoters/genes change activation status through developmental time?
This is not a statistic, but a visualization of data cohesion.
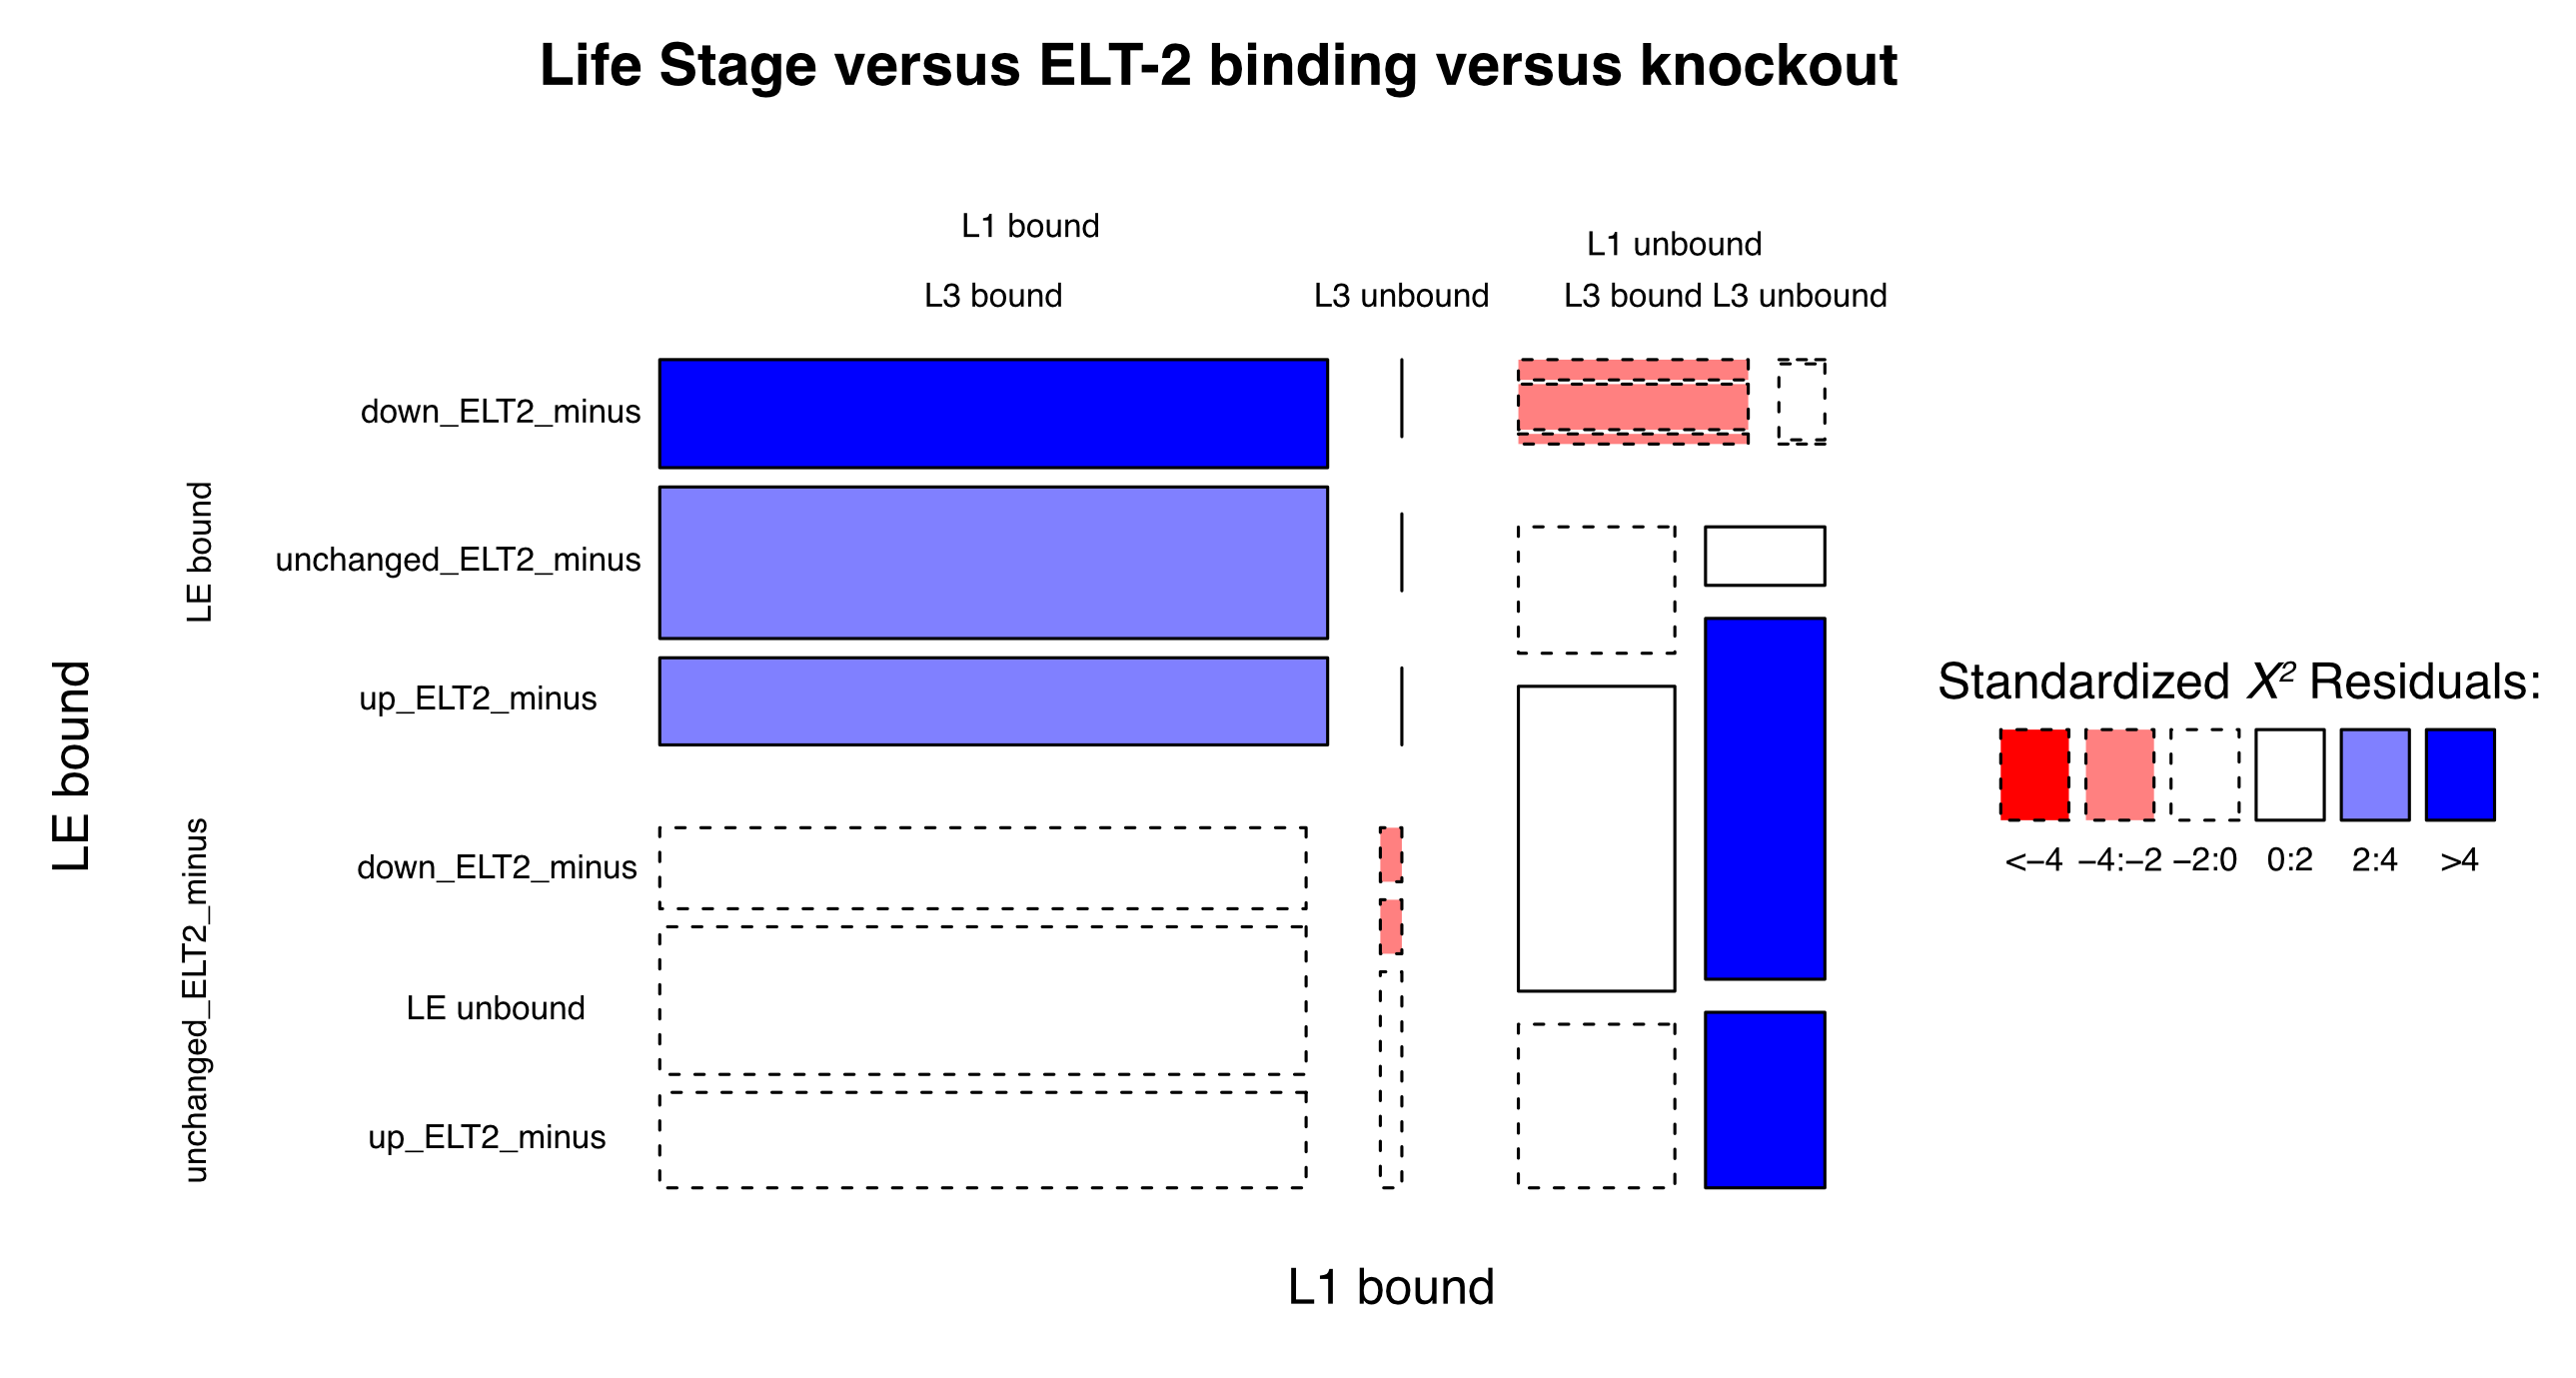
Mosaic plot
Question: What are the profiles of ELT-2 binding with regard to life stage and genetic effect?
When looking for associations among multiple factors, a Chi-sq test can be used to determine if any combinations are represented more or less than expected. However, the χ2 test only gives an overall p-value. There are methods to study the χ2 residuals in order to see where the data deviate from random expectation.
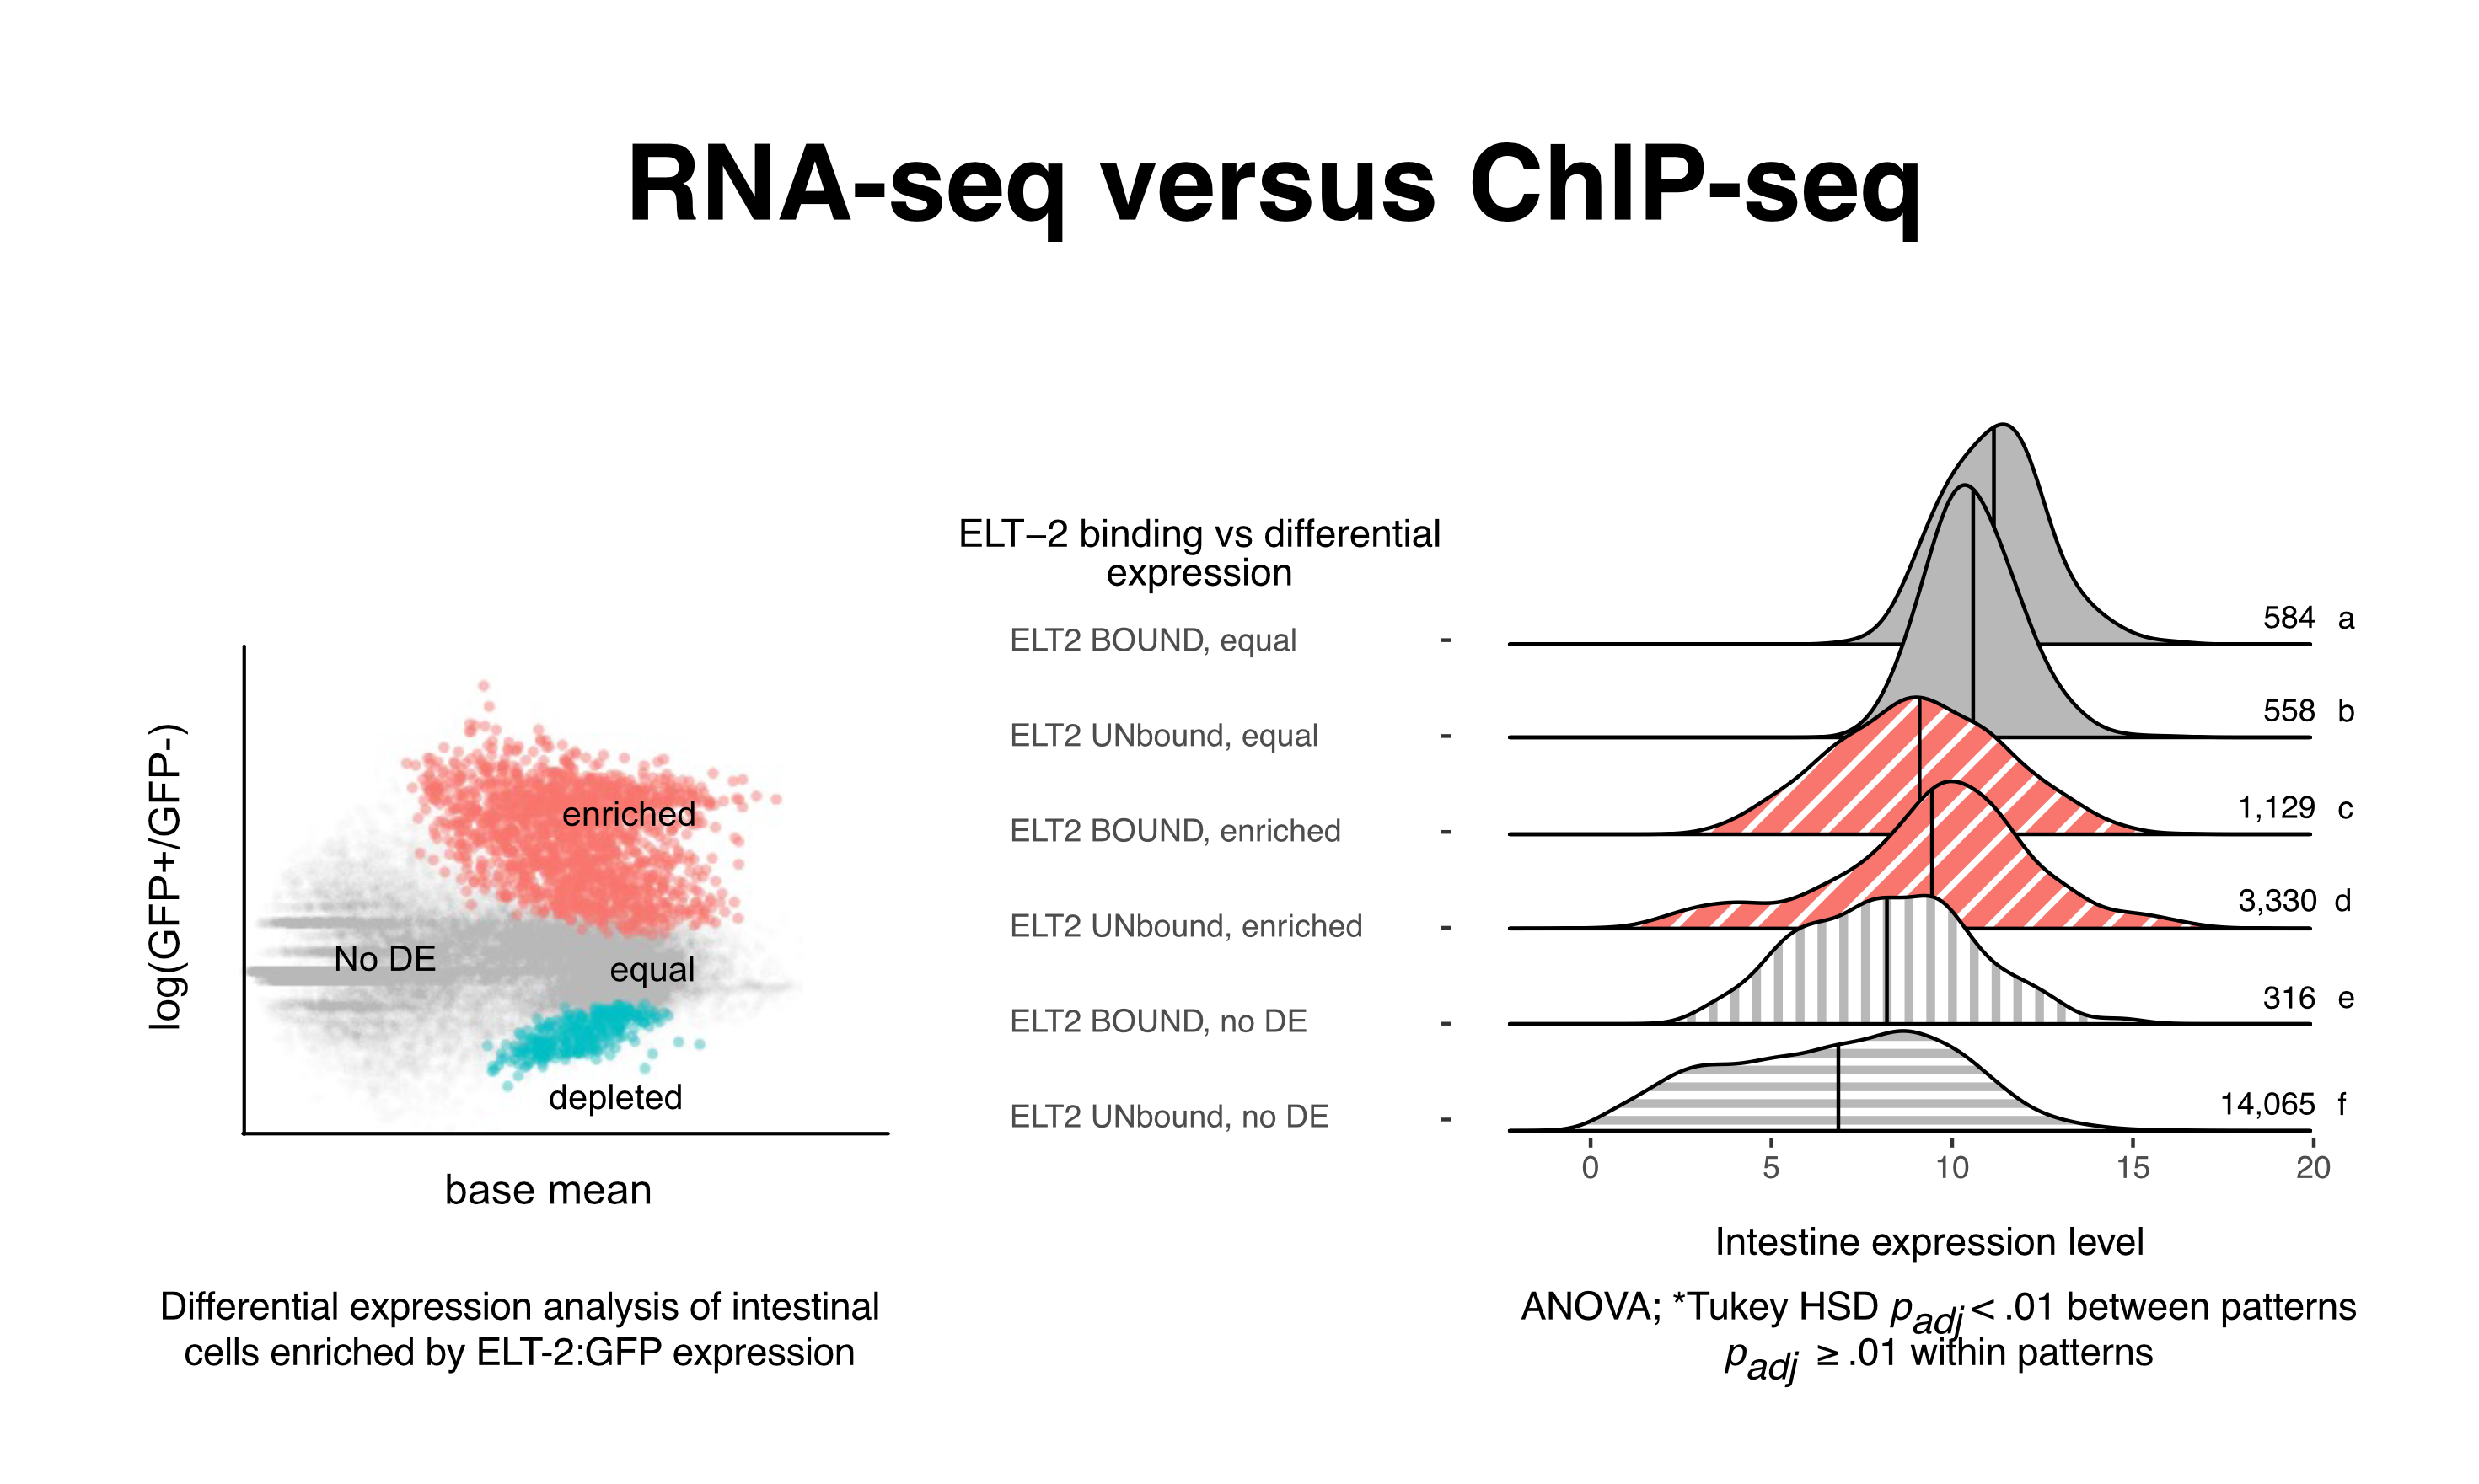
Tukey Honest Significant differences
Question: Does transcription factor binding correlate with gene expression level?
With ANOVA, ask whether groups better explain the data. Our data has groups of many levels, and therefore must apply multiple tests, and corrections, to control statistical rigor. This analysis did not find the ELT-2 bound genes to be higher expressed. Most of the genes are known to be ELT-2 dependent, therefore this result suggests that the dependence is qualitative, not quantitative.
Correspondence analysis
Question: How does ELT-2 binding associate with other transcription factors in regulating intestinal gene expression?
Building on the published work from Williams et al., this correspondence analysis explored the associations between ELT-2 binding sites and other published transcription factor binding sites (modENCODE), integrating the RNA-seq results from the Williams et al. publication. This multivariate approach suggested potential patterns of co-occupancy and potential regulatory interactions between ELT-2 and other transcription factors in the intestinal gene regulatory network.
Categorical regression
Question: Does gene expression level depend on ELT-2 binding status across different categorical groups?
To rigorously test whether ELT-2 binding quantitatively affects gene expression, I performed systematic categorical regression testing interaction terms between binding status (bound vs. not bound) and expression levels determined by RNA-seq. This analysis ruled out quantitative dependence on ELT-2 binding categories, reinforcing that ELT-2’s role in gene regulation is qualitative rather than simply correlating with higher expression levels.
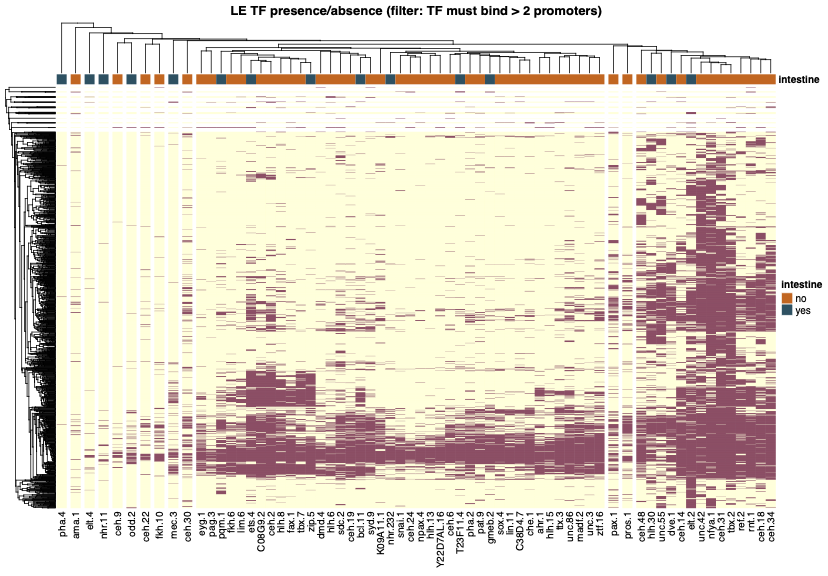
Clustering
Question: What other transcription factors might explain gene expression in the intestine?
The search continues for explanatory transcription factors. In C. elegans, there is a well-curated set of transcription factors. Many of these are known to be expressed in the intestine, and many were studied in the modENCODE project with ChIP-seq. This analysis identifies genome-wide patterns of binding.